Veltar Media
Live to tell stories
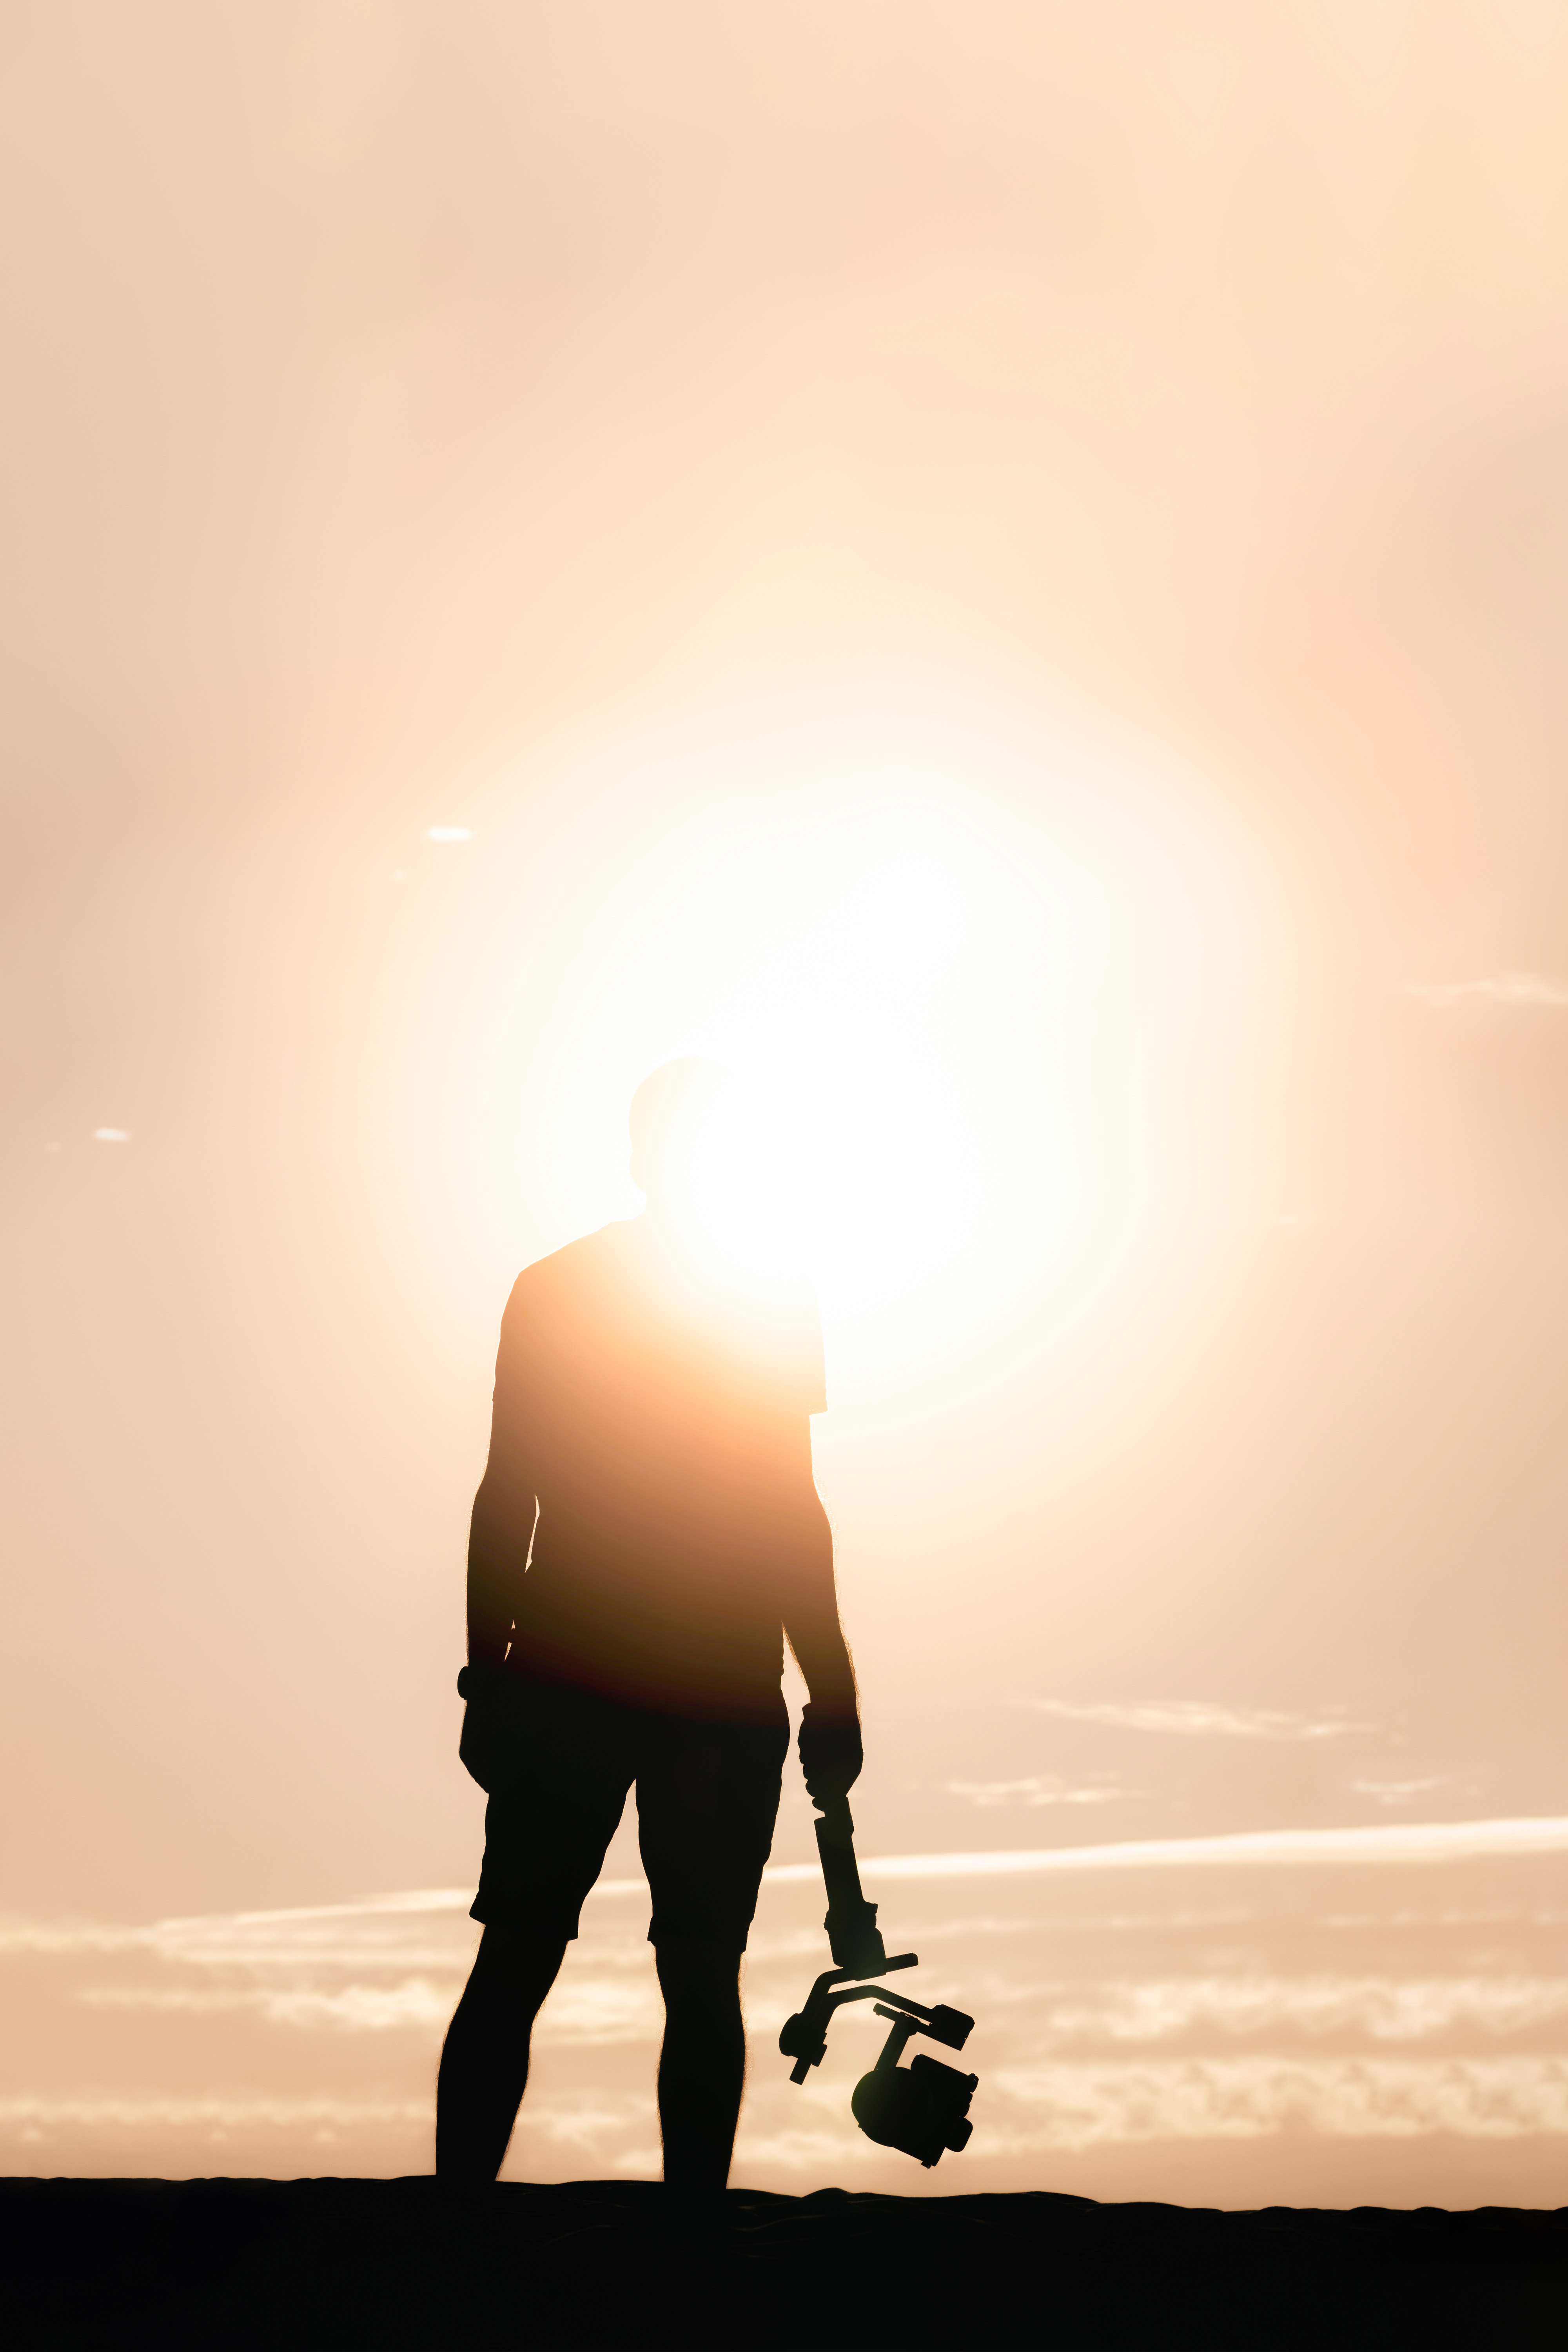
Photographe & Filmmaker
Voir le book